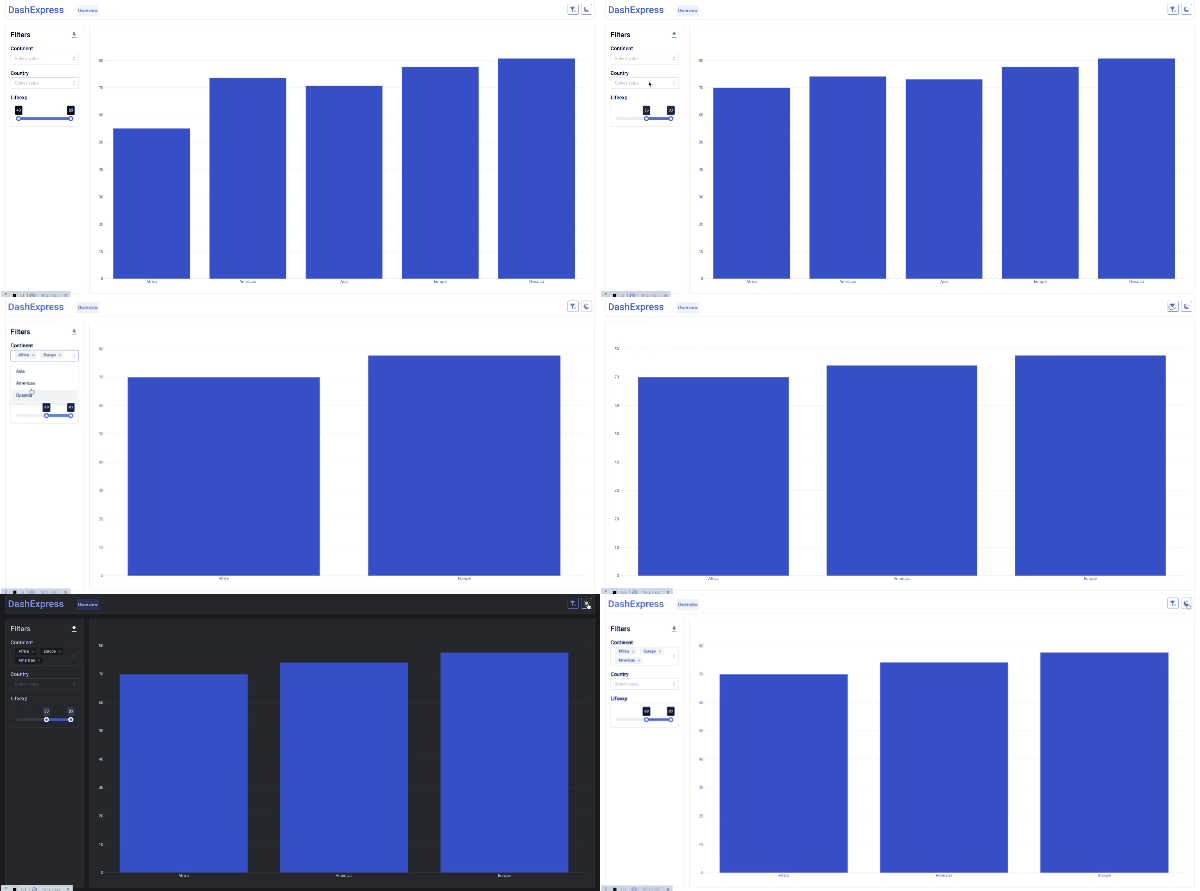
Minimal app

The first step is to import the necessary libraries
import pandas as pd
import plotly.graph_objects as go
import dash_mantine_components as dmc

from dash_express import DashExpress, Page
Next, you need to initialize an instance of the Dash Express application. Note that Dash Express uses caching by default to improve performance. If your application already has a flask_caching object.Cache you can pass it to Dash Express.
app = DashExpress(
    logo='DashExpress',          # navbar logo, string or dict: {'dark':'path/to/darklogo.svg', 'light':...}
    cache=True,                  # flask_caching.Cache instance, dict or True (default: True)
    default_cache_timeout=3600,  # flask_caching.Cache timeout in seconds (default: 3600)
    app_shell=...,               # Appshell class for customization UI your app (default: BaseAppShell())
    # And standart Plotly Dash param
 )
The Dash Express object implements a Dash application with a pre-configured interface and automatic callback generation for quickly creating interactive multi-page web analytics applications.
Page definition
Each application page is a separate object, an instance of the dash_express' class.Page. The page contains the source data for analysis, graph creation functions and a list of filters.
page = Page(
    app=app,                    # DashExpress app
    url_path='/',               # page url
    name='Owerview',            # page name in navigation buttons
    get_df=get_df,              # function for getting pd.DataFrame
    title='Owerview',           # page title
    )
Getting data
The 'get_df` function contains the logic of getting data:
get_df = lambda: pd.read_csv('https://raw.githubusercontent.com/plotly/datasets/master/gapminder2007.csv')
Dashboard layout
Next, you need to determine the layout of the dashboard. we recommend using dmc.Grid and dmc.SimpleGrid
page.layout = dmc.SimpleGrid(
    page.add_graph(h='100%',render_func=bar_func)
    )
The render_func parameter of the page.add_graph method is a graph generation function based on data from a DataFrame
# The logic of drawing a graph
def bar_func(df):
    pv = pd.pivot_table(df, index='continent', values='lifeExp').reset_index()
    fig = go.Figure([go.Bar(x=pv['continent'], y=pv['lifeExp'])])
    return fig
The last action is to add filters, which is done by simply calling the page.add_filter method and specifying the filtering column.
page.add_autofilter('continent', multi=True)
page.add_autofilter('country', multi=True)
page.add_autofilter('lifeExp', multi=True)
App run
These actions are enough to create a fully functional dashboard, so you can run the application.
app.run()
Full code of the minimal application
import pandas as pd
import plotly.graph_objects as go
import dash_mantine_components as dmc

from dash_express import DashExpress, Page


# Incorporate data
get_df = lambda: pd.read_csv('https://raw.githubusercontent.com/plotly/datasets/master/gapminder2007.csv')

# Initialize the app
app = DashExpress(logo='DashExpress')

# Initialize the Page
page = Page(
    app=app,                    # DashExpress app
    url_path='/',               # page url
    name='Owerview',            # page name in navigation buttons
    get_df=get_df,              # function for getting pd.DataFrame
    title='Owerview',           # page title
    )

# The logic of drawing a graph
def bar_func(df):
    pv = pd.pivot_table(df, index='continent', values='lifeExp').reset_index()
    fig = go.Figure([go.Bar(x=pv['continent'], y=pv['lifeExp'])])
    return fig

# Dashboard layout
page.layout = dmc.SimpleGrid(
    page.add_graph(h='calc(100vh - 138px)',render_func=bar_func)
    )

# By which columns to filter
page.add_autofilter('continent', multi=True)
page.add_autofilter('country', multi=True)
page.add_autofilter('lifeExp', multi=True)

app.run(debug=True)
Requirements
Python 3.7+
DashExpress stands on the shoulders of giants:
- Plotly Dash for the web parts.
- Pandas DataFrame for the data store & compute measure.
- Dash Mantine Components for the create pretty UI
- Dash Leaflet for the create maps
License
This project is licensed under the terms of the MIT license.